by Thomas M. Green

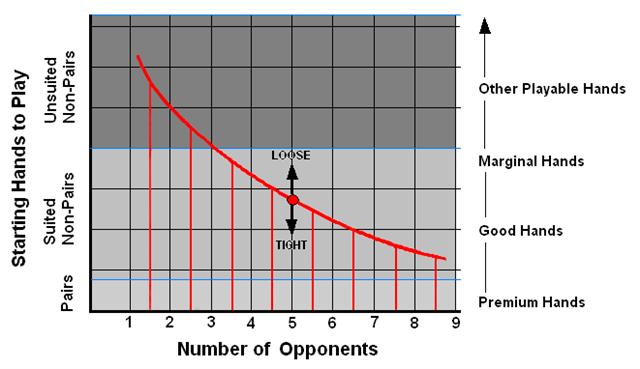
Fig. 86 Hypothetical Graph Indicating
Potential Starting Hand to Play vs.Number of Opponents.
Use Either the Left Vertical Scale or the Right Vertical Scale.
Shift the Curve Up In a Loose Game, Shift the Curve Down In a Tight Game.
The graph in Fig. 86 indicates that with more opponents in the hand, it is recommended that
you play fewer potential starting hands.
This is only a hypothetical representation of the actual recommended starting hands and
should be regarded only as a guide to the concept that with more players the more likely it is
that someone else has a good to premium hand. Since that is the case, the recommended
number of starting hands you should consider playing is reduced to the good, or premium hands.
Conversely, with fewer opponents, you can consider playing more starting hands that fall into
the marginal or playable hands categories. If you are heads up in play, almost any two random
cards could win.
The shape and position of the graph are simply an indication of concept. The graph is just an
example of a decreasing function y vs. x, meaning the more of x, the less of y. If you are a
tight player (discussed below in the section Player Strategy: Type of Play), the function curve
would be shifted lower and if you are a loose player (discussed below in that same section), it
could be shifted upward.
The number of different hands that a tight player might reasonably play is decreased and the
number is increased for a loose player.